RightMark Audio Analyzer test report
| Testing device | US-1641_2496 |
| Sampling mode | 24-bit, 96 kHz |
| Interface | ASIO |
| Testing chain | External loopback (line-out - line-in) |
| RMAA Version | 6.0.6 PRO |
| 20 Hz - 20 kHz filter | ON |
| Normalize amplitude | ON |
| Level change | -0.8 dB / -0.7 dB |
| Mono mode | OFF |
| Calibration singal, Hz | 1000 |
| Polarity | correct/correct |
Summary
| Frequency response (from 40 Hz to 15 kHz), dB | +0.03, -0.10 |
Excellent |
| Noise level, dB (A) | -104.7 |
Excellent |
| Dynamic range, dB (A) | 104.4 |
Excellent |
| THD, % | 0.0026 |
Excellent |
| THD + Noise, dB (A) | -88.7 |
Good |
| IMD + Noise, % | 0.0036 |
Excellent |
| Stereo crosstalk, dB | -102.4 |
Excellent |
| IMD at 10 kHz, % | 0.012 |
Very good |
| General performance | Excellent |
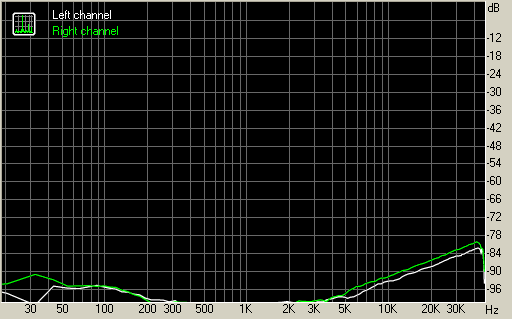
Frequency response
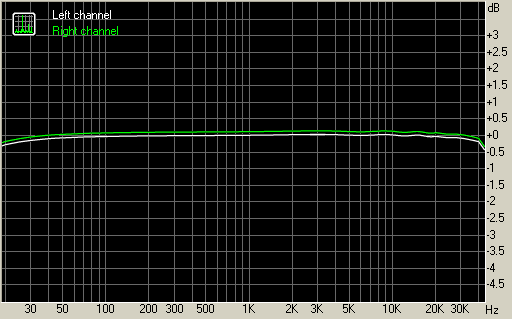
| From 20 Hz to 20 kHz, dB | -0.28, +0.03 |
| From 40 Hz to 15 kHz, dB | -0.10, +0.03 |
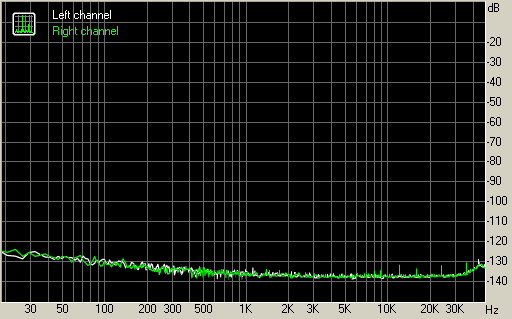
Noise level
Left |
Right |
|
| RMS power, dB | -103.5 |
-103.6 |
| RMS power (A-weighted), dB | -104.6 |
-104.7 |
| Peak level, dB FS | -81.8 |
-83.0 |
| DC offset, % | +0.0 |
+0.0 |
Dynamic range
Left |
Right |
|
| Dynamic range, dB | +103.2 |
+103.2 |
| Dynamic range (A-weighted), dB | +104.3 |
+104.5 |
| DC offset, % | +0.00 |
+0.00 |
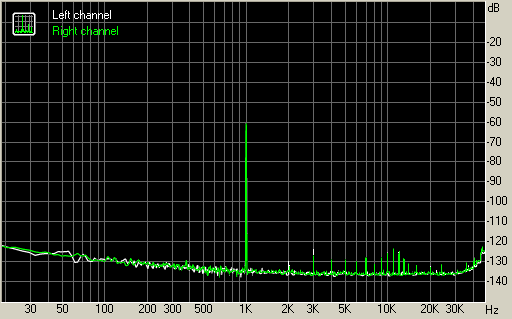
THD + Noise (at -3 dB FS)
Left |
Right |
|
| THD, % | +0.0024 |
+0.0027 |
| THD + Noise, % | +0.0029 |
+0.0032 |
| THD + Noise (A-weighted), % | +0.0035 |
+0.0038 |
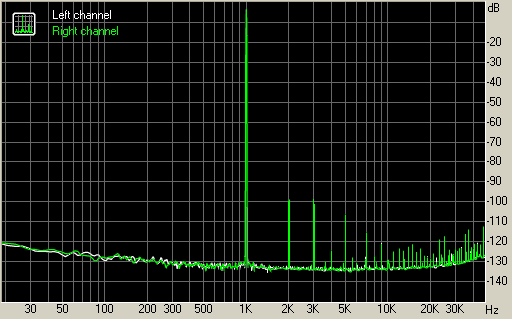
Intermodulation distortion
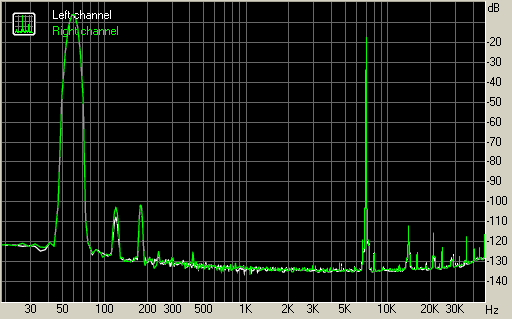
Left |
Right |
|
| IMD + Noise, % | +0.0034 |
+0.0037 |
| IMD + Noise (A-weighted), % | +0.0027 |
+0.0028 |
Stereo crosstalk
Left |
Right |
|
| Crosstalk at 100 Hz, dB | -94 |
-94 |
| Crosstalk at 1000 Hz, dB | -101 |
-102 |
| Crosstalk at 10000 Hz, dB | -92 |
-91 |
IMD (swept tones)
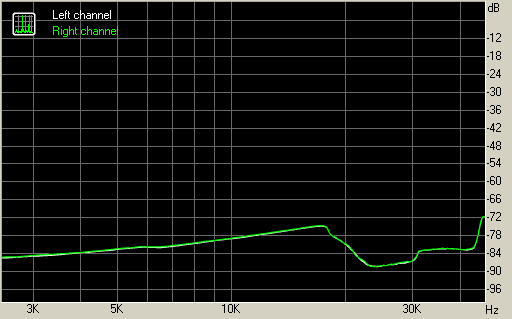
Left |
Right |
|
| IMD + Noise at 5000 Hz, | 0.0074 |
0.0076 |
| IMD + Noise at 10000 Hz, | 0.0112 |
0.0114 |
| IMD + Noise at 15000 Hz, | 0.0163 |
0.0166 |