RightMark Audio Analyzer test report
| Testing device | M-Audio USB 2.0 ASIO 48 Without Power |
| Sampling mode | 24-bit, 48 kHz |
| Interface | ASIO |
| Testing chain | External loopback (line-out - line-in) |
| RMAA Version | 6.1.1 PRO |
| 20 Hz - 20 kHz filter | ON |
| Normalize amplitude | ON |
| Level change | 0.0 dB / 0.2 dB |
| Mono mode | OFF |
| Calibration singal, Hz | 1000 |
| Polarity | inverted/inverted |
Summary
| Frequency response (from 40 Hz to 15 kHz), dB | +0.02, -0.12 |
Excellent |
| Noise level, dB (A) | -101.9 |
Excellent |
| Dynamic range, dB (A) | 101.9 |
Excellent |
| THD, % | 0.0018 |
Excellent |
| THD + Noise, dB (A) | -90.7 |
Very good |
| IMD + Noise, % | 0.0029 |
Excellent |
| Stereo crosstalk, dB | -95.0 |
Excellent |
| IMD at 10 kHz, % | 0.0032 |
Excellent |
| General performance | Excellent |
Frequency response
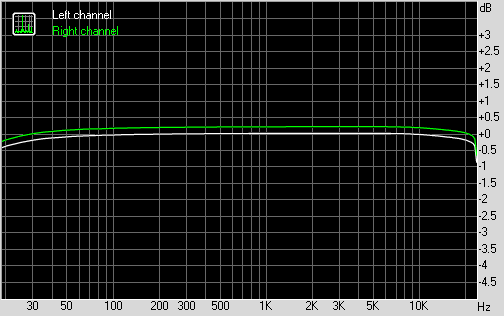
| From 20 Hz to 20 kHz, dB | -0.37, +0.02 |
| From 40 Hz to 15 kHz, dB | -0.12, +0.02 |
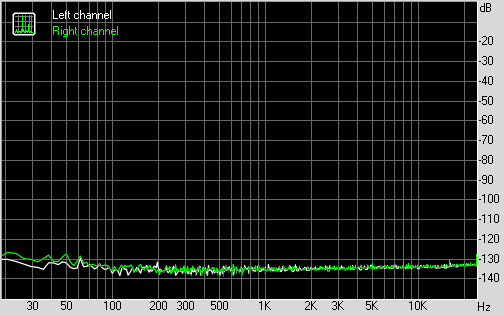
Noise level
Left |
Right |
|
| RMS power, dB | -100.8 |
-100.6 |
| RMS power (A-weighted), dB | -101.9 |
-101.8 |
| Peak level, dB FS | -86.9 |
-86.2 |
| DC offset, % | -0.0 |
-0.0 |
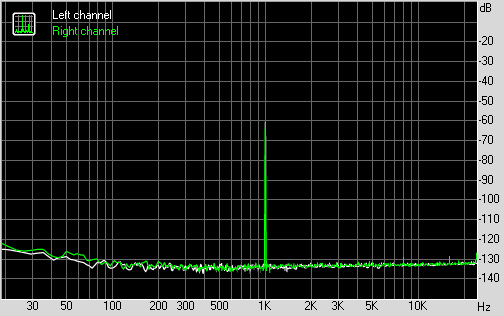
Dynamic range
Left |
Right |
|
| Dynamic range, dB | +100.8 |
+100.6 |
| Dynamic range (A-weighted), dB | +102.1 |
+101.8 |
| DC offset, % | +0.00 |
+0.00 |
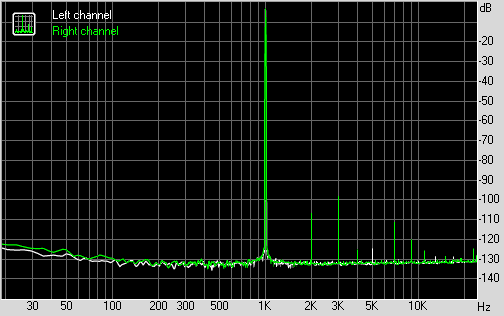
THD + Noise (at -3 dB FS)
Left |
Right |
|
| THD, % | +0.0017 |
+0.0019 |
| THD + Noise, % | +0.0026 |
+0.0027 |
| THD + Noise (A-weighted), % | +0.0028 |
+0.0030 |
Intermodulation distortion
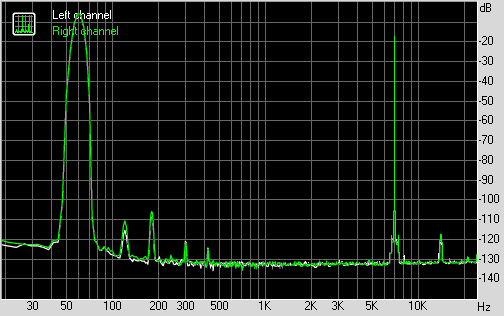
Left |
Right |
|
| IMD + Noise, % | +0.0029 |
+0.0030 |
| IMD + Noise (A-weighted), % | +0.0024 |
+0.0025 |
Stereo crosstalk
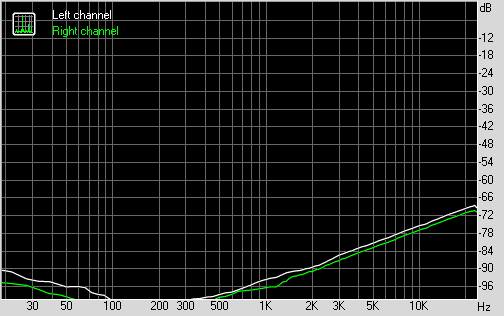
Left |
Right |
|
| Crosstalk at 100 Hz, dB | -100 |
-101 |
| Crosstalk at 1000 Hz, dB | -93 |
-95 |
| Crosstalk at 10000 Hz, dB | -74 |
-76 |
IMD (swept tones)
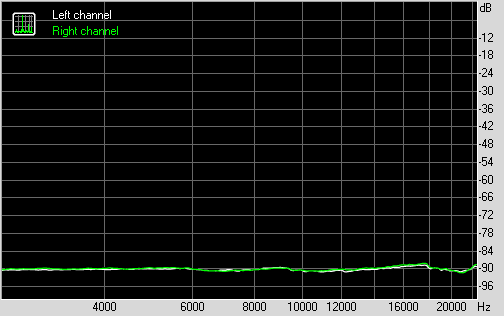
Left |
Right |
|
| IMD + Noise at 5000 Hz, | 0.0032 |
0.0033 |
| IMD + Noise at 10000 Hz, | 0.0030 |
0.0030 |
| IMD + Noise at 15000 Hz, | 0.0032 |
0.0034 |